Architecture
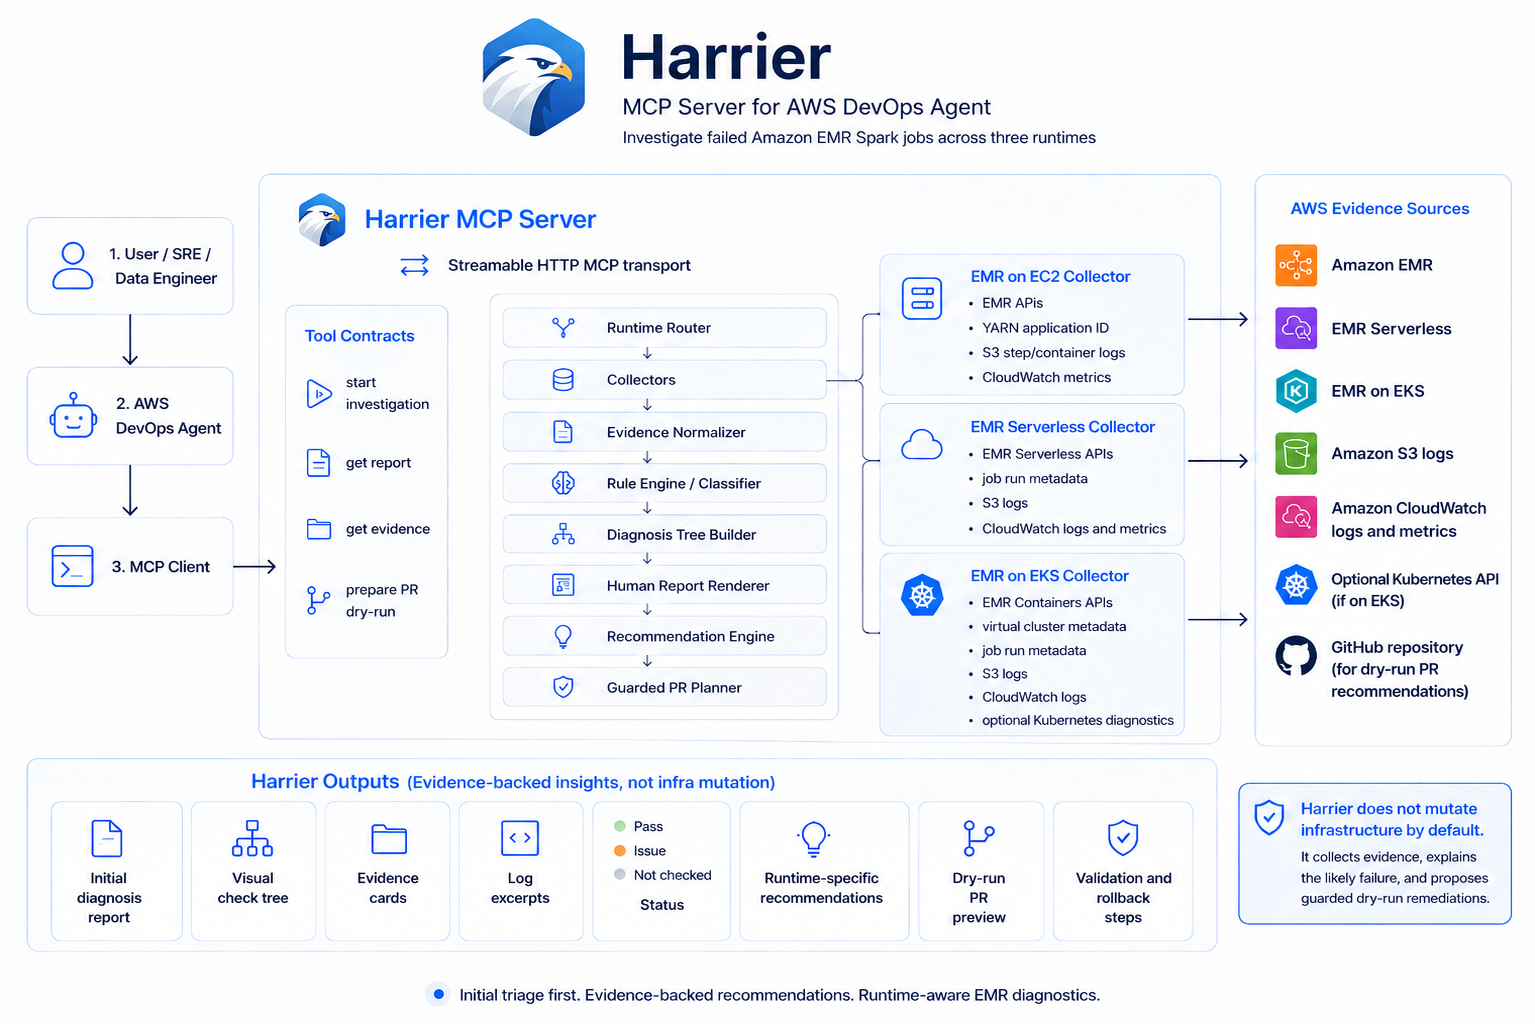
Harrier is a headless MCP service consumed by AWS DevOps Agent.
Drop 1 deploys Harrier on ECS Fargate and exposes Streamable HTTP MCP tools. The service stores investigation state and evidence summaries separately from raw logs.
Demo scenarios are deliberately outside this repository.
Spark Deploy Modes
Harrier must handle both Spark deploy modes:
cluster: the driver runs in the YARN application, so driver logs are typically in YARN/container logs.client: the driver runs on the submitting host, such as the EMR primary node or Livy host, so driver logs may be in step/controller/Livy/primary-node logs.
Investigation input accepts deploy_mode as client, cluster, or unknown. When unknown, Harrier should infer it from EMR step arguments, Spark submit configuration, and log layout evidence.
Runtime Targets
Harrier accepts runtime-aware investigation targets so EMR on EC2, EMR Serverless, and EMR on EKS can use distinct identity fields without overloading EC2/YARN terminology.
Supported runtimes:
emr_ec2: target includescluster_id, optionalstep_id, and optionalyarn_application_id.emr_serverless: target includesserverless_application_id,job_run_id, and optionalattempt.emr_eks: target includesvirtual_cluster_id,job_run_id, and optional EKS cluster/namespace hints.
The legacy flat EC2 request shape remains valid. The old top-level application_id field is treated only as a deprecated alias for the EC2/YARN application id; EMR Serverless application ids use target.serverless_application_id.
Target validation and normalization happens before runtime providers run, so runtime-specific collectors receive only the identifiers they own.
Runtime Provider Layer
Harrier routes runtime-specific collection through a provider boundary:
harrier_start_emr_investigation
  -> RuntimeRouter
     -> EmrEc2Provider
     -> EmrServerlessProvider
     -> EmrEksProvider
  -> runtime-neutral classification, recommendations, report storage, and PR flow
Each provider exposes:
collect_job_metadatabuild_timelinecollect_logscollect_metrics
EmrEc2Provider wraps the existing EMR, S3 log, and CloudWatch collectors without changing their behavior. EmrServerlessProvider owns Serverless metadata, log, and metric collection. EmrEksProvider owns EMR Containers metadata plus configured S3 and CloudWatch Logs collection for EMR on EKS job runs. Runtime routing prevents EKS and Serverless requests from accidentally using EC2/YARN collectors.
Code analysis, DB diagnostics, deterministic classification, recommendation generation, Bedrock refinement, report persistence, and MCP response formatting stay runtime-neutral.
Runtime capability matrix:
| Runtime | Metadata | Logs | Metrics | Kubernetes |
|---|---|---|---|---|
| EMR on EC2 | Implemented through elasticmapreduce. |
Implemented through bounded S3 archived logs. | Implemented through AWS/ElasticMapReduce. |
Not applicable. |
| EMR Serverless | Implemented through emr-serverless. |
Implemented through configured S3 and CloudWatch Logs. | Implemented through AWS/EMRServerless. |
Not applicable. |
| EMR on EKS | Implemented through emr-containers. |
Implemented through configured S3 and CloudWatch Logs. | Deferred; Harrier returns a recoverable warning when a time window is supplied. | Optional read-only pod diagnostics implemented. |
Diagnosis Report Layer
After collection, classification, and recommendations, Harrier builds a runtime-neutral Initial Diagnosis Report. This report is a human-facing triage map, not the final root-cause analysis.
The diagnosis layer converts existing findings, evidence, and recoverable warnings into:
- top-level areas: Infrastructure, Data, Spark Runtime, Observability, Configuration, and Kubernetes for EMR on EKS
- status values:
PASS,ISSUE,WARN,UNKNOWN, andNOT_CHECKED - evidence cards that separate observed facts from interpretation
- bounded log excerpts rendered in fenced
logblocks - explicit inconclusive checks with reasons such as
LOGS_UNAVAILABLE,METRICS_UNAVAILABLE, andKUBERNETES_ACCESS_UNAVAILABLE - runtime-specific visual check trees for EC2, Serverless, and EKS
human_report_markdown, which AWS DevOps Agent can show directly to operators
The renderer is generated from the same structured fields that are stored in InvestigationReport, so Agent UI rendering and plain Markdown output stay consistent.
Runtime check tree differences:
| Runtime | Runtime-specific checks |
|---|---|
| EMR on EC2 | IAM/S3/KMS, cluster capacity, HDFS/local storage, ResourceManager/YARN, driver, executors, shuffle, memory, dependencies. |
| EMR Serverless | execution role, application/job run state, driver worker, executor workers, worker sizing, Serverless S3 logs, CloudWatch logs, Serverless metrics. |
| EMR on EKS | execution role/IRSA, virtual cluster, namespace, driver pod, executor pods, image pull, scheduling, evictions, Spark runtime, optional Kubernetes access. |
Golden Markdown snapshots in mcp-server/tests/golden/diagnosis_reports/ protect the public report shape for representative EC2, Serverless, EKS, IAM/access-denied, and unknown-evidence cases.
Runtime-Specific Recommendations
Harrier's base recommendation engine remains finding-driven and runtime-neutral, so existing EMR on EC2 findings continue to produce the same recommendations. When harrier_start_emr_investigation has runtime context, it can append runtime-specific patch-plan hints:
JOB_CONFIG: EMR Serverless worker sizing, executor shape, dynamic allocation bounds, and application maximum-capacity guidance.OBSERVABILITY: S3 and CloudWatch Logs monitoring configuration for EMR Serverless and EMR on EKS when log evidence is missing or log collection was skipped.KUBERNETES: EMR on EKS pod template, resource request/limit, scheduling constraint, image, and dependency guidance.
These recommendations are advisory patch plans by default. They may be included in dry-run PR previews, and selected recommendations may apply machine-applicable allowlisted source edits in a guarded PR. Harrier still does not apply live AWS, Kubernetes, Spark, DAG, or database changes directly.
Long-Running Job Diagnosis
Harrier must investigate jobs that are still running and have not failed yet. In that path it should identify what the Spark job is doing now, explain likely delay drivers, and separate data issues from resource issues.
Data-delay signals include skewed stages, a small number of long-running tasks, excessive shuffle spill, unusually large input partitions, slow JDBC reads, and DB-side waits or bad plans.
Resource-delay signals include pending YARN containers, saturated cluster memory or vCPU, executor loss/retry churn, insufficient capacity, and HDFS or node health pressure.
When evidence is incomplete, Harrier should return a confidence-scored explanation and the missing evidence needed to confirm it rather than waiting for the job to fail.
EMR Metadata Collection
The EMR collector reads same-account EMR metadata through boto3:
DescribeClusterfor cluster name, status, release label, applications, log URI, and instance collection typeListInstanceGroupsfor requested/running instance counts and group shapeDescribeStepfor step state, action on failure, timeline, failure details, and Spark submit argumentsListStepsfor recent step context when the caller does not provide a step id
The collector normalizes recoverable AWS errors into warnings. Permission failures, missing cluster/step records, and missing step IDs should not crash the rest of an investigation.
Spark deploy mode is inferred from spark-submit --deploy-mode and spark.submit.deployMode where possible. Active YARN application IDs are extracted only when visible in EMR step metadata; otherwise S3/YARN log collection is responsible for correlation.
EMR Serverless Collection
The EMR Serverless provider reads same-account Serverless metadata through boto3:
GetApplicationfor application state, release label, type, and application-level monitoring configuration.GetJobRunfor job-run state, execution role, retry attempt, timeline fields, release label, and job-level monitoring overrides.ListJobRunAttemptsfor bounded retry-attempt context.
The provider normalizes Serverless job states into Harrier's runtime-neutral running, completed, failed, and unknown states. It builds timeline events from application creation/update and job creation/start/end timestamps, and treats permission, missing-resource, and AWS client failures as recoverable warnings.
Serverless log discovery uses the job-run monitoring configuration first and falls back to the application monitoring configuration. S3 logs are discovered under the Serverless application/job/attempt layout, while CloudWatch Logs streams are discovered from the configured log group and optional stream-name prefix. Both paths emit normalized driver/executor LogSource records and scan bounded excerpts through the shared log scanner.
Serverless metric collection reads one-minute CloudWatch metrics from AWS/EMRServerless when a request includes a time window. The collector uses current Serverless dimensions with application/job names, falling back to [Unspecified] for missing or non-ASCII names. It samples application and job-worker metrics for running jobs, pending worker creation, worker CPU, worker memory, ephemeral storage, and storage IO.
Serverless metric evidence feeds Harrier's runtime-neutral classifier. Pending worker creation and high CPU/memory/storage utilization become RUNNING_JOB_RESOURCE_DELAY evidence, while an active job without obvious CloudWatch resource pressure becomes RUNNING_JOB_DATA_DELAY evidence. Missing metrics, invalid windows, and CloudWatch permission failures are recoverable warnings.
EMR On EKS Collection
EMR on EKS target validation and baseline collection are available. Callers provide target.virtual_cluster_id and target.job_run_id, with optional target.eks_cluster_name and target.namespace hints for Kubernetes diagnostics.
EmrEksProvider is backed by the EMR Containers API:
DescribeVirtualClusterfor virtual cluster state and EKS namespace context.DescribeJobRunfor job-run state, release label, execution role, retry/status details when present in the SDK response, and monitoring configuration.ListJobRunsfor bounded nearby job-run context.
EmrEksLogLayout models normalized EKS log sources for submitter, driver pod, and executor pod logs. The EKS provider discovers configured S3 and CloudWatch Logs destinations from the job-run monitoring configuration, emits LogSource records, and reuses the shared S3/CloudWatch scanners so EKS stack traces feed the same classifier rules as EC2 and Serverless.
EKS metric collection is intentionally deferred. If the caller supplies a time_window, Harrier returns a recoverable warning and continues metadata/log investigation.
Kubernetes diagnostics are optional, read-only, and best-effort. When a Kubernetes client is configured, Harrier inspects pods in the target namespace and captures pod phase, container state, restart counts, OOMKilled, ImagePullBackOff, Evicted, and unschedulable/pending reasons. These signals can classify EKS_DRIVER_POD_FAILED, EKS_EXECUTOR_POD_EVICTED, EKS_POD_PENDING, and EKS_IMAGE_PULL_FAILURE. EKS investigations still work without Kubernetes API access; missing cluster access is reported as a recoverable warning.
The Kubernetes client path is intentionally optional for deployment portability. Local runs can use a normal kubeconfig. Container or Agent-hosted deployments can either install the optional Python kubernetes dependency and provide in-cluster or kubeconfig access, or include kubectl and a readable kubeconfig. If neither path is configured, the EKS provider still uses EMR Containers, S3, and CloudWatch Logs evidence.
S3 Log Collection
The S3 log collector samples archived EMR logs without loading whole objects:
- Parses EMR
s3://bucket/prefixlog URIs. - Lists objects under the cluster log prefix with pagination.
- Identifies step logs, controller logs, and YARN/container logs.
- Uses Spark deploy mode to choose driver log layout:
- client mode: step/controller logs are searched first for driver evidence.
- cluster mode: YARN/container logs are searched first for driver evidence.
- Infers deploy mode from log layout only when the input and EMR step metadata are inconclusive, and warns when layout is ambiguous.
- Reads bounded byte ranges from each selected log object.
- Supports gzip-compressed log excerpts.
- Searches for classifier-relevant signals such as OOM, AccessDenied, dependency errors, shuffle spill, executor loss, HDFS pressure, and DB/JDBC errors.
- Redacts likely secrets before storing excerpts as evidence.
- Flags suspicious prompt-like text found inside logs so downstream reasoning can treat it as untrusted evidence.
Generic Log Sources
Log discovery is separated from log scanning. Runtime-specific layout strategies produce normalized LogSource records:
EmrEc2LogLayout: EMR on EC2 cluster, step, controller, and YARN/container S3 paths.EmrServerlessLogLayout: EMR Serverless application/job/attempt S3 paths and CloudWatch stream paths.EmrEksLogLayout: EMR on EKS virtual-cluster/job/container S3 paths and CloudWatch stream paths.
Each LogSource records runtime, backend (s3 or cloudwatch), role (driver, executor, controller, submitter, etc.), source URI, and backend-specific identifiers. The existing EC2 S3 collector preserves its behavior but now gets role classification from EmrEc2LogLayout.
Pattern matching, redaction, evidence ID generation, and prompt-injection detection live in a shared log scanner used by both S3 and CloudWatch log collectors.
CloudWatch Logs collection is bounded with GetLogEvents limits and per-stream character caps. It emits the same structured EvidenceItem categories as S3 logs, allowing Serverless and EKS providers to reuse the classifier without duplicating Spark failure rules.
CloudWatch Metric Collection
The CloudWatch metrics collector reads EMR cluster metrics from AWS/ElasticMapReduce:
- Queries the caller's time window with a fixed 300-second period to match standard EMR metric resolution.
- Uses
JobFlowIdas the cluster dimension. - Summarizes each metric into bounded datapoints, latest/min/max/average values, and a coarse trend.
- Treats missing metrics and CloudWatch permission failures as recoverable warnings.
- Derives resource-pressure flags from pending YARN apps/containers, low YARN available memory, HDFS utilization, and unhealthy/lost node metrics.
- Derives
running_job_data_delay_possiblewhen the cluster is active but CloudWatch does not show obvious resource pressure. - Correlates supplied log timestamps that fall inside the metric window so later end-to-end investigation can align metrics with log evidence.